INSYDOR — KNOW WHAT TO SELL. KNOW WHY.
Takealot Listing AnalyticsSee the sales behind every product
Estimate Takealot product sales, explore up to 36 months of sales trends, and review listing history—all directly on Takealot. Compare products and find which listings are worth a closer look.
Start with free usage
The numbers behind a Takealot listing
From estimated daily sales to historical trends and listing details, INSYDOR helps you understand product performance and compare listings directly on Takealot.
Feature 01
Explore Takealot sales trends over time
Review estimated Takealot sales trends over 3, 6, 12, 24, or 36 months, depending on available data. Switch between Quantity (units sold) and Volume (sales value), or view individual product variants when available.
What you can see
- Estimated sales trends for 3, 6, 12, 24, or 36 months
- Quantity (units) and Volume (sales value)
- Summary and individual product variant views
Why it matters
Check if estimated sales are growing, stable, or declining. Compare different time periods to see how sales change and whether a product sells steadily over time.
Feature 02
Check daily sales estimates and listing history
See how many units a Takealot product is estimated to sell per day. Check its first available review date, estimated listing age, and historical lowest price.
What you can see
- First Review Date
- Months Since Listing
- Average Daily Sales for the selected period
- Historical Lowest Price
Why it matters
Estimated daily sales help you understand how a product may be selling. Listing age shows how long it has been around, while historical lowest price gives you a price reference. Together, these numbers help you better understand a listing.




Feature 03
Compare Takealot listings at a glance
Compare key details across multiple products on supported Takealot category pages. See average daily sales, listing age, historical lowest price, and sales trends side by side—without opening every product one by one.
What you can see
- First Review Date and Months Since Listing
- Number of product variants
- Average daily sales
- Historical lowest price
- Mini sales trend charts
- Quick access to individual listing analytics
Why it matters
Compare several products on one page to find the ones worth a closer look. Check their sales estimates and trends, then open detailed analytics for products you want to learn more about.
How to read a Takealot listing analysis
Learn how average daily sales, sales trends, listing age, and historical lowest price work together when researching a product on Takealot.
SEE IT IN ACTION
How to make sense of the numbers
1. Start with average daily sales
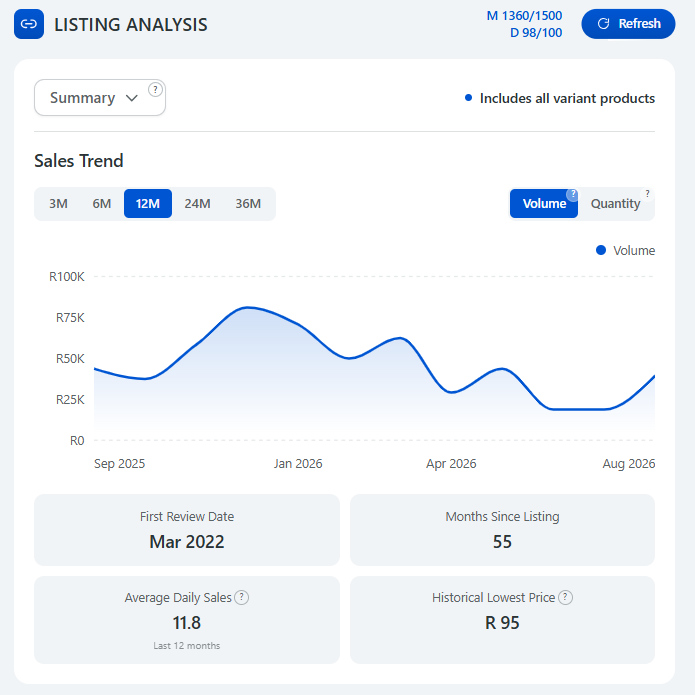
This listing is estimated to sell an average of 11.8 units per day over the selected 12-month period. Compare this figure with similar Takealot products to see how well it performs.
2. Explore sales trends over time
The chart shows Volume (estimated sales value). Switch to Quantity to see estimated units sold. Compare short-term and long-term trends to see whether estimated sales are growing, declining, or staying steady.
3. Understand the listing's history
The first review date is March 2022, and the listing age is 55 months. Use these numbers to understand how long the product has been on Takealot and compare it with newer or older listings.
4. Check historical lowest price
The historical lowest price is R95. Compare it with the current price to see how low the product has been priced before. This helps you understand its pricing and consider how much room you may have to compete on price.
Use these insights together to understand product performance, compare similar listings, and find products worth selling on Takealot. Make better product decisions with a clearer view of sales, trends, and pricing.
Analyze a Takealot product in 3 steps
Install INSYDOR to check sales estimates, trends, and listing details directly on Takealot.
Install INSYDOR
Install the INSYDOR Chrome extension and sign in.
Open a Takealot product
Go to any Takealot product page you want to analyze.
Run listing analysis
Open the Listing Analysis tab in INSYDOR and click Refresh to view the results.
Make better decisions with INSYDOR
Check average daily sales, explore sales trends, and review key product details before you decide what to sell on Takealot.
Install extensionStart with free usage. Upgrade when you need more analyses.