INSYDOR — KNOW WHAT TO SELL. KNOW WHY.
Takealot Brand AnalyticsTrack brand sales and find leading products
View a brand’s estimated sales trends and price bands on Takealot. Check its Top 5 sellers, categories, and listings. See how estimated sales are changing, where its products are priced, and which listings lead. Then pick products to compare.
Three ways to understand a brand on Takealot
Follow sales trends, compare price bands, and find leading products and sellers. Bring the results together to understand the brand’s product range.
Feature 01
See how brand sales are changing
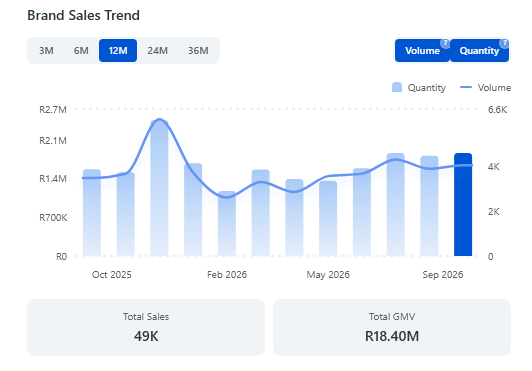
View estimated brand sales over 3, 6, 12, 24, or 36 months, depending on available data. Switch between units sold and sales value, and check totals for the selected period.
What you can see
- Estimated sales over 3, 6, 12, 24, or 36 months
- Estimated units sold and sales value
- Estimated units and sales value totals for the selected period
Why it matters
Check if sales are rising, stable or falling, and spot seasonal patterns. Compare time periods to see if strong sales hold.
Feature 02
Find the brand’s main price points
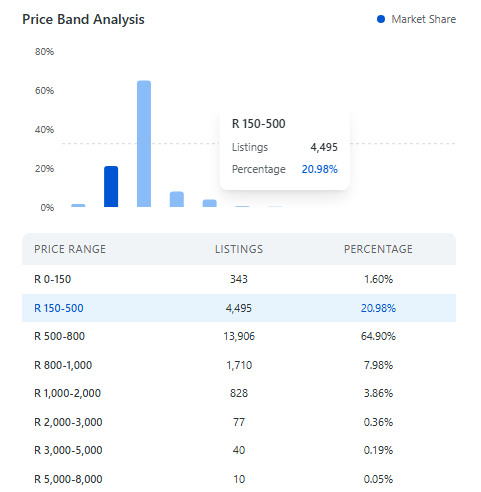
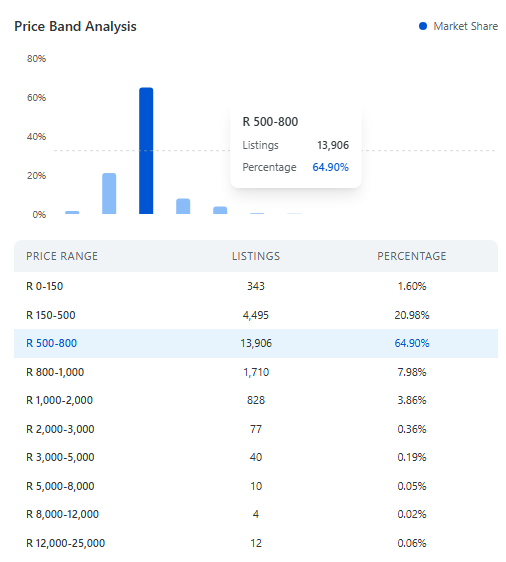
See how the brand’s listings are distributed from lower to higher prices, with listing counts and percentages for each price band.
What you can see
- Listings in each price band
- Share of the brand’s listings in each band
- The most populated price bands
Why it matters
Find brand listings priced close to your products and decide which competitors to compare first.
Feature 03
Find leading products and sellers
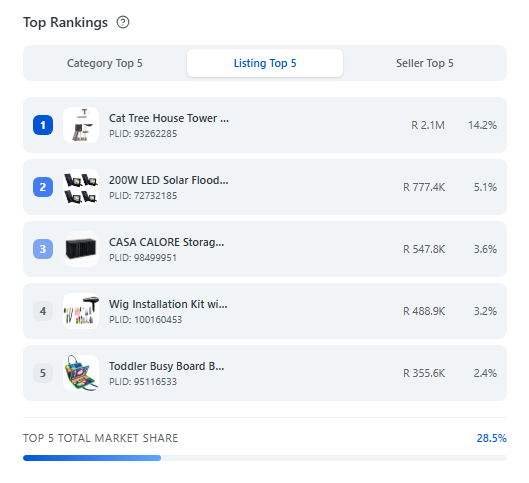
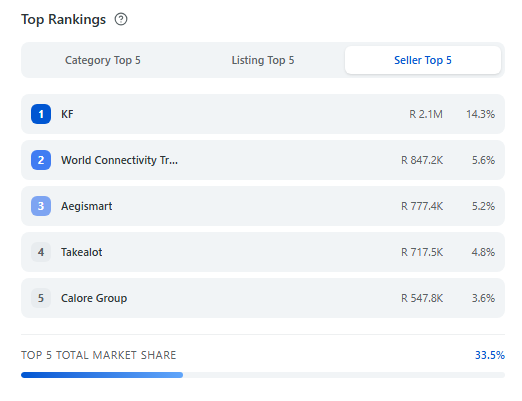
Switch between the brand’s top 5 sellers, categories, and listings. Compare estimated sales value, units, and each ranking’s combined share.
What you can see
- Top 5 sellers, categories, and listings
- Estimated sales value and units
- Combined share of the top 5
Why it matters
Find the brand’s leading listings, main categories, and top sellers, then choose specific products for your competitor comparison.
How to read a Takealot brand analysis
Don't judge a brand by one chart. Read sales trends, price bands, and top sellers and listings together.
SEE IT IN ACTION
How to make sense of the results
1. Start with the brand’s overall sales and main price band
On the trend chart, this brand’s estimated sales value over the past 12 months sits at roughly R18.40M. Across the price bands, 64.90% of its listings fall between R500 and R800. This signals mass mid-range positioning with a solid, steady sales base. If a brand has this foundation, the category may still be worth exploring.
2. Check the seller lineup — are they connected?
Open Seller Top 5. The top seller holds 14.3% share, and the top five sellers combined account for 33.5%. Follow up by visiting these leading seller stores for comparison. If their store names, fulfilment setup or product ranges look closely linked, they may be the brand’s own store matrix or core partner operators. If the sellers appear independent, you are looking at open competition. Understanding your rivals helps you assess whether you can compete.
3. Identify top listings you can compete against
The main price band may be busy, so open Listing Top 5. The No.1 cat tree listing carries roughly R2.1M in estimated sales value and captures 14.2% of the brand’s total share. Even when a brand looks diversified, a small number of listings drive most of its revenue. These top listings make ideal references for product research.
4. Decide where to focus next
This brand enjoys steady sales, yet its core price band is saturated. Do not treat generic R500–R800 products as your default entry point. Instead, zero in on this cat tree listing: examine its sales trends, pricing and product features, then read reviews to spot unresolved pain points or unmet demand. Differentiation is the way to carve out space to enter the category.
Choose products to compare, then explore their sales trends and listing history with Listing Analytics. Continue with Listing Analytics.
Analyze a Takealot brand in 3 steps
Install INSYDOR and explore brand data directly on Takealot.
Install INSYDOR
Install the INSYDOR Chrome extension and sign in.
Open a product or brand page
Go to a Takealot product or brand page for the brand you want to analyze.
Run brand analysis
In Market Research, open Brand Analysis and click Fetch Analysis.
Compare a brand’s sales, prices, and leading products
Connect brand performance with individual listings to guide product selection and competitor comparisons.
Install extensionNew product ranking, brand analysis, and seller analysis share the category analytics quota.