INSYDOR — KNOW WHAT TO SELL. KNOW WHY.
Takealot Category AnalyticsUnderstand the market before choosing what to sell
Explore estimated sales trends, compare price bands, and see which sellers, brands, and listings lead a category—all directly on Takealot. Use these insights to spot opportunities and make more informed product decisions.
Start with free usage
What a Takealot category can tell you
Strong sales can make a category look attractive, but they don't tell the whole story. You also need to know how steady those sales are and how tough the competition may be.
Feature 01
Explore category sales trends
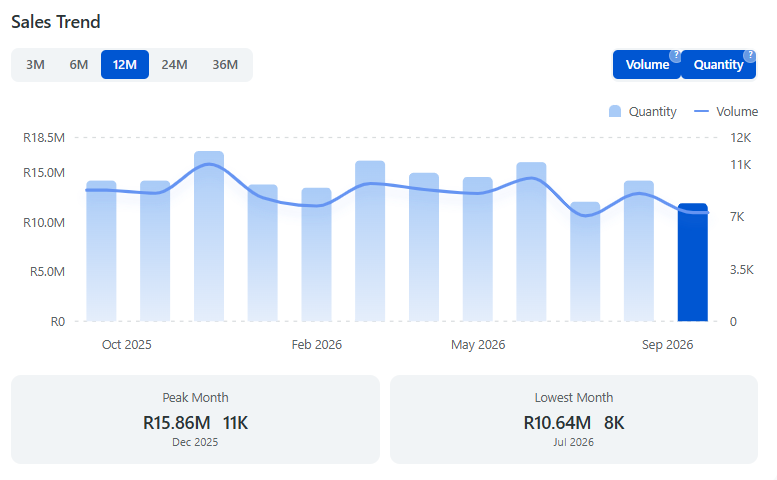
Review estimated category sales trends over 3, 6, 12, 24, or 36 months, depending on available data. Switch between Quantity (units sold) and Volume (sales value), and check which months had the highest and lowest estimated sales.
What you can see
- Estimated sales trends over 3, 6, 12, 24, or 36 months
- Quantity (units sold) and Volume (sales value)
- Months with the highest and lowest estimated sales
Why it matters
Compare different periods to see whether sales are growing, staying steady, or following a seasonal pattern. One busy month may not reflect the rest of the year.
Feature 02
See how listings are priced
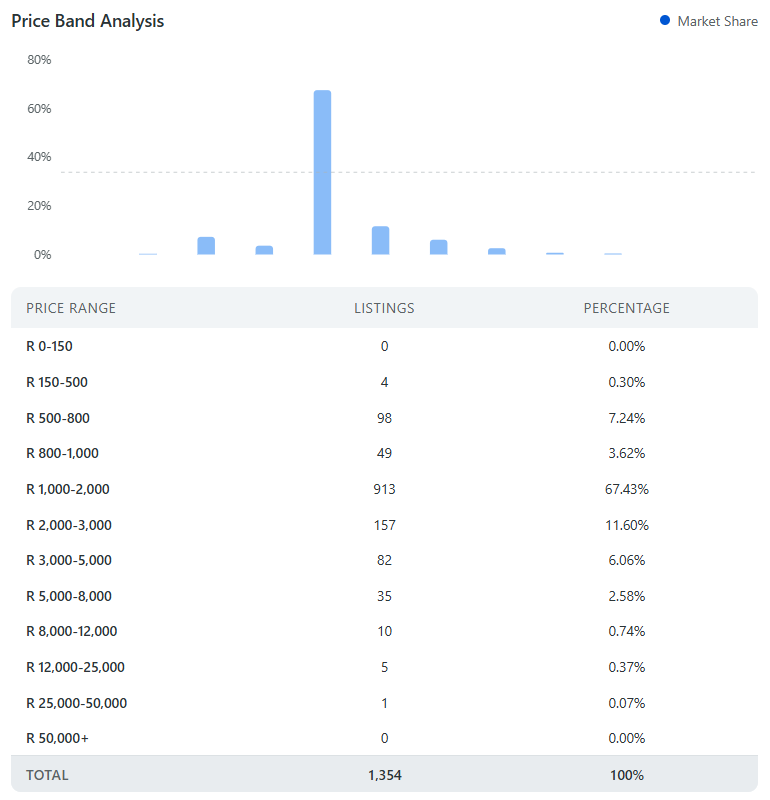
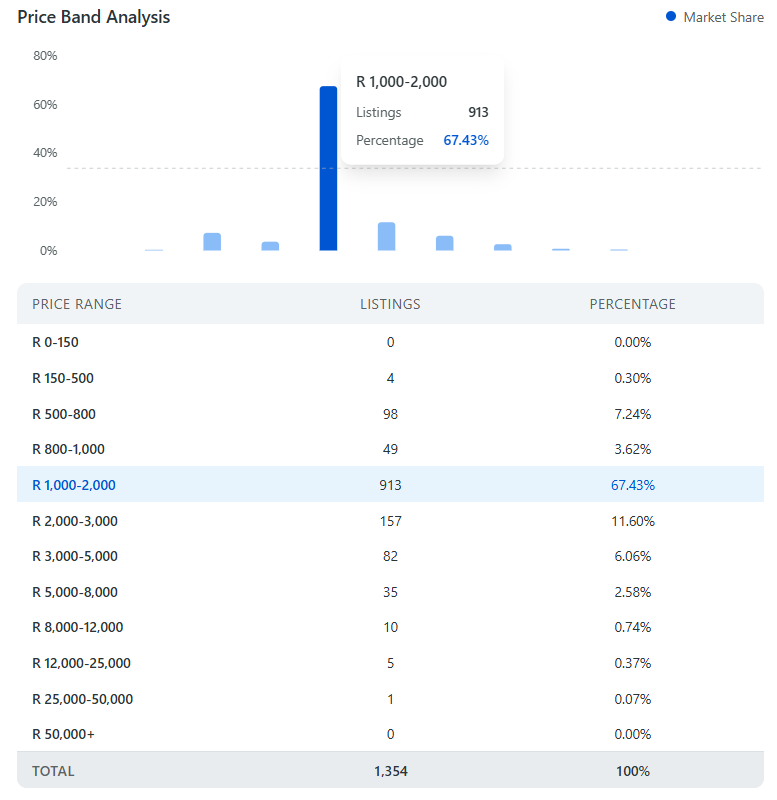
See how prices vary across a Takealot category, from lower-priced to higher-priced products. INSYDOR groups listings into price bands, showing the number and percentage of listings in each band.
What you can see
- Number of listings in each price band
- Percentage of listings in each price band
- Price bands with the most listings
Why it matters
See which prices are common and where you may face more competing listings. Fewer listings do not necessarily mean stronger demand.
Feature 03
See who leads the category
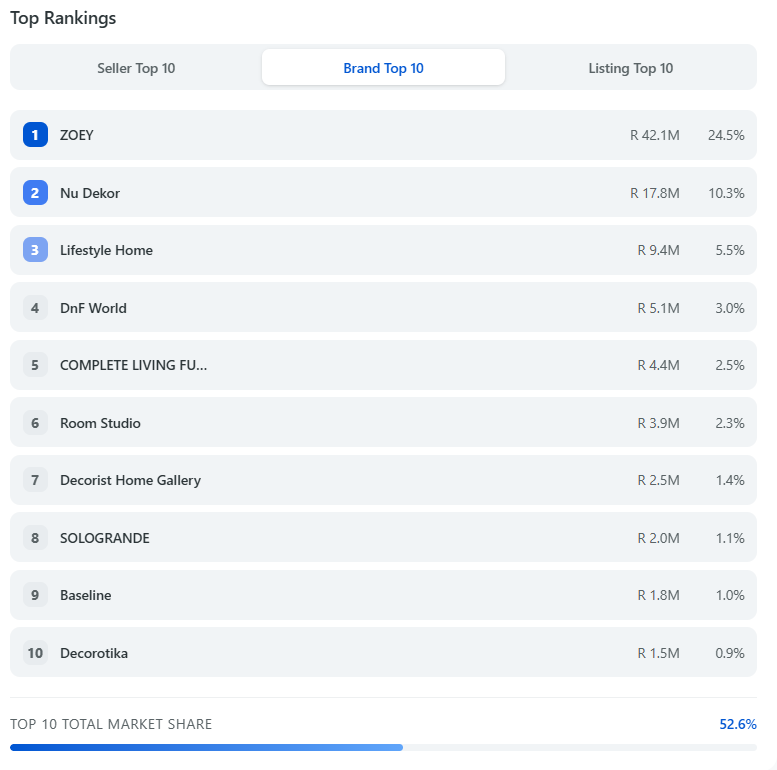
Explore the top 10 sellers, brands, and listings in a Takealot category. Compare their estimated units sold and sales value, and check the top 10 share shown in each ranking to see how the leading players compare.
What you can see
- Top 10 sellers, brands, and listings
- Estimated sales value and units
- Share of the top 10
Why it matters
See whether sales are spread across many competitors or concentrated among a few leaders. This can help you judge how difficult the category may be to enter.
How to read a Takealot category analysis
Learn how to use the results together instead of judging a category by a single number.
SEE IT IN ACTION
How to make sense of the results
1. Start with category sales
Estimated monthly sales stayed fairly steady over the past 12 months, with some ups and downs. Sales reached R15.86M in December 2025 and dropped to R10.64M in July 2026. This suggests relatively stable demand, but strong sales don't always mean it's easy for new sellers to compete.
2. Look at where products are priced
Out of 1,354 listings, 913 (67.43%) fall into the R1,000–2,000 price band. This is where most listings are concentrated, making it a crowded price band. However, listing counts don't tell us which products sell best. To understand the competition further, we also need to look at who leads the market.
3. See which brands lead the market
ZOEY leads with an estimated sales value of R42.1M, accounting for 24.5% of the category. The top 10 brands together hold 52.6% of the market. This shows that a large share of sales goes to a small group of leading brands, adding another challenge for sellers looking to enter the category.
4. Decide where to focus your research
The category has ongoing sales, but entering it may not be easy. Most listings are concentrated in one price band, while leading brands account for a large share of sales. Before choosing a product, take a closer look at listings in your target price band. Compare their sales, prices, and features to see where you may be able to compete.
The goal isn't just to find a category that sells well. It's to find one where you have a realistic chance to compete. Continue with Listing Analytics.
Analyze a Takealot category in 3 steps
Install INSYDOR and view category data directly on Takealot.
Install INSYDOR
Install the INSYDOR Chrome extension and sign in.
Open a Takealot category
Go to the Takealot category page you want to analyze.
Run category analysis
Open the Category Analysis tab in INSYDOR and click Refresh to view the results.
Make better decisions with INSYDOR
Get a broader view of each category and decide which markets are worth your attention.
Install extensionStart with free usage. Upgrade when you need more analyses.