INSYDOR — KNOW WHAT TO SELL. KNOW WHY.
Takealot New ProductsFind new products worth checking out
Rank new products by estimated sales value on a Takealot category page. Switch between 1-, 3-, and 6-month ranges to compare estimated units sold, estimated sales value, and share. See which new products are showing up in the category. Pick listings to compare.
Which new products should you look into?
Use INSYDOR to compare new-product sales, check each listing, and see how much the top 30 account for before choosing what to research next.
Feature 01
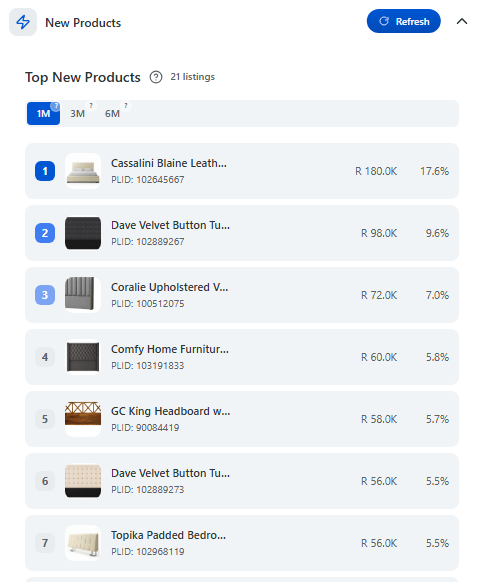
Choose a range to find new products
With INSYDOR, switch between 1-, 3-, and 6-month ranges to compare different groups of new products.
What you can see
- 1-, 3-, and 6-month ranges
- Number of new listings in the selected range
- Up to 30 listings sorted by estimated sales value
Why it matters
Use 1 month for the most recent group, or 3 and 6 months to broaden your comparison. Compare listings within the same range to build your shortlist.
Feature 02
Compare new-product sales
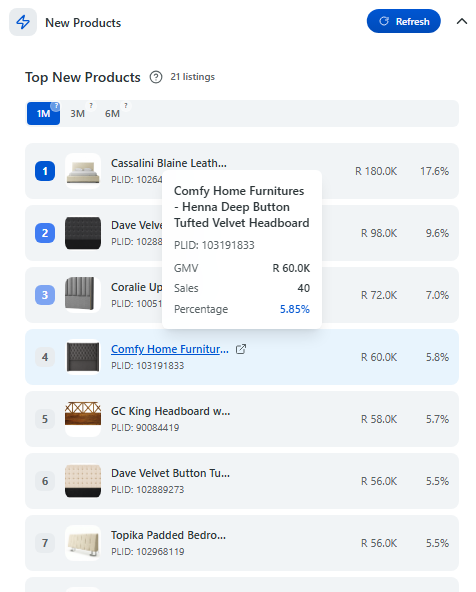
Each listing shows estimated sales value and its share of sales value among new products in the selected range. Hover over a row to see estimated units and more details.
What you can see
- Estimated sales value
- Estimated units sold
- Share of sales value among new products in the selected range
Why it matters
Compare estimated units and sales value to find hot new products, then open their listings to check prices, product features, and buyer reviews,see which new products showed up recently and are doing well.
Feature 03
See top 30 sales share
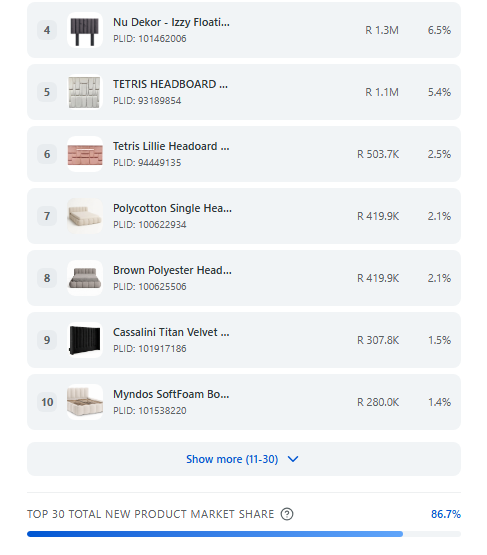
Check the total sales share of the top 30 listings, to learn how much of all new product sales they take.
What you can see
- Total sales share of the top 30 new listings
- Total new listings in your chosen range
Why it matters
Use these two numbers to check if most sales belong to the top listings. When there are few new listings, the top 30 will cover almost all available listings.
How to read a Takealot new product ranking
Don't judge new listings by one time range. Read new-listing counts, leading products, and top-30 share together.
SEE IT IN ACTION
How to make sense of the results
1. Start with how many new listings appear in each time window
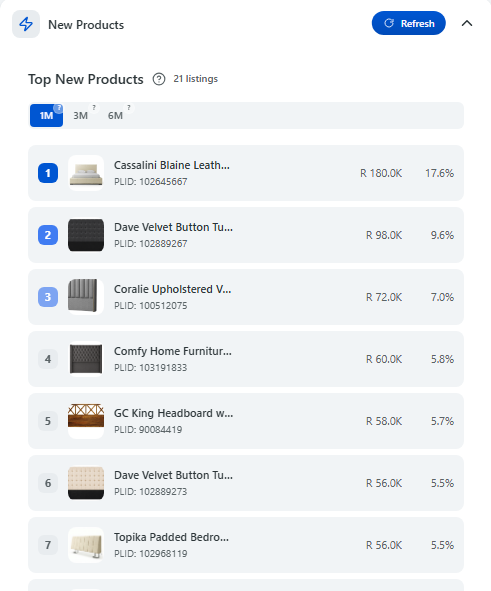
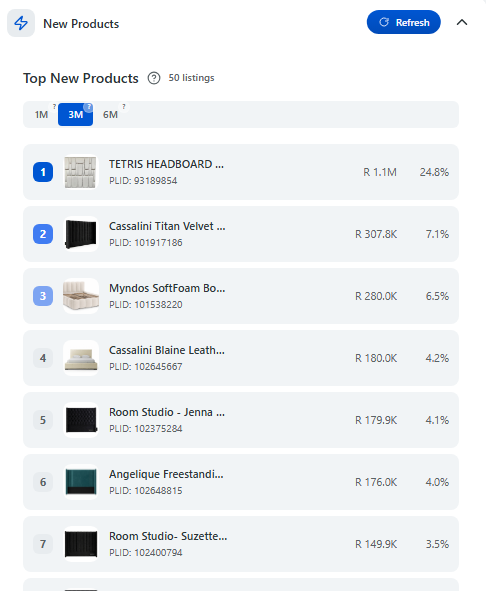
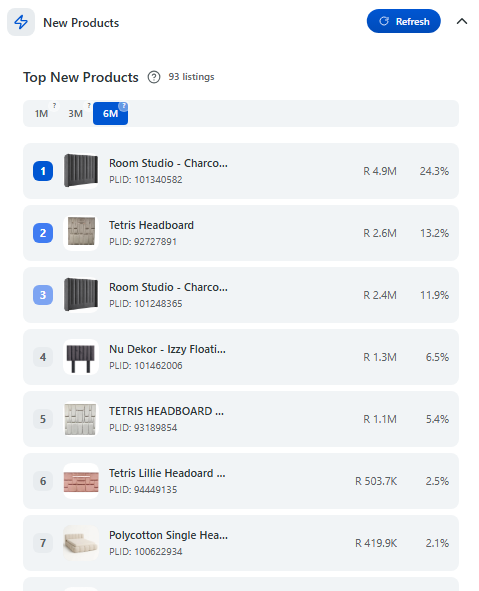
Take this home category as an example. The 1-month window shows 21 new listings, 3 months shows 50, and 6 months shows 93. New listings are appearing often here. The longer the window, the more listings you can compare.
2. Use the 1-month ranking to find fast-rising listings
In the 1-month window, the No. 1 listing is a Cassalini bed frame with about R180K in estimated sales value. This new listing is picking up sales quickly. If you want to spot hot new sellers before competition builds up, open this listing first.
3. Compare the 6-month ranking for steady top sellers
Why not stop at 1 month? In the 6-month window, Room Studio leads with about R4.9M in estimated sales value and a 24.3% share. The TETRIS headboard ranks No. 2 at about R2.6M. Some products sell well after launch and keep selling. These consistent listings are worth a closer look for product differentiators.
4. Use top-30 sales share to decide where to focus
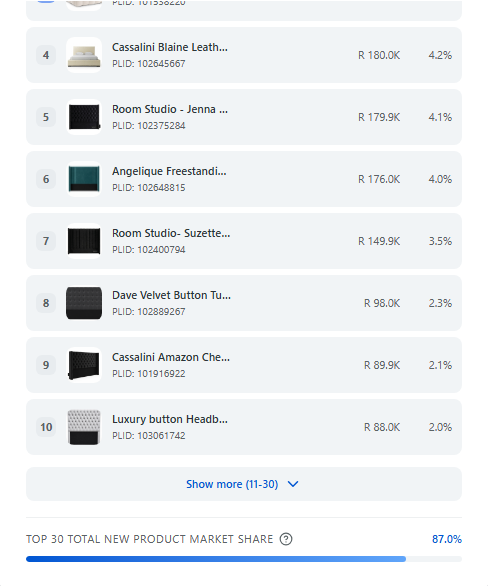
Across all time windows, the top 30 capture more than 80% of new-product sales value — for example 87.0%. Most sales value sits at the top of the ranking. Don't spend too long on long-tail listings. Focus on the top 30, compare estimated sales, prices, and product features, then decide whether to launch similar products.
For demand trends and competition across the category, explore Category Analytics. Continue with Category Analytics.
Explore new products on Takealot in 3 steps
Install INSYDOR and open the ranking on the Takealot category page.
Install INSYDOR
Install the INSYDOR Chrome extension and sign in.
Open a Takealot category
Go to the category you want to explore for new products.
Run the new product ranking
In Market Research, open New Products and click Fetch Analysis. Switch ranges to compare the results.
Start your next product shortlist with new listings
Compare new-product sales and spend more time on the listings worth a closer look.
Install extensionNew product ranking, brand analysis, and seller analysis share the category analytics quota.