INSYDOR — KNOW WHAT TO SELL. KNOW WHY.
Takealot Seller AnalyticsExplore a seller’s range and find product ideas
Browse a seller’s listings directly on Takealot. Toggle between viewing scopes to see estimated sales trends, price bands, plus the seller’s top 5 listings, brands and categories. Discover the products, brands and categories the seller stocks, and identify listings to add to your product shortlist.
Understand a seller through the products they stock
See which listings only this seller sells, where their products are priced, and which brands and categories they stock. Bring these together to understand their product range.
Feature 01
Find listings only this seller sells
Choose a view range to see listings sold only by this seller, or every listing they sell—including those shared with other sellers. Each selection shows its own trends, price bands, and rankings.
What you can see
- Listings sold only by this seller
- All listings the seller sells
- Trends, price bands, and top 5 rankings for the selected listings
Why it matters
Separate this seller’s exclusive listings from their shared listings, then choose the products most relevant to your business for comparison.
Feature 02
Check sales trends and main price points
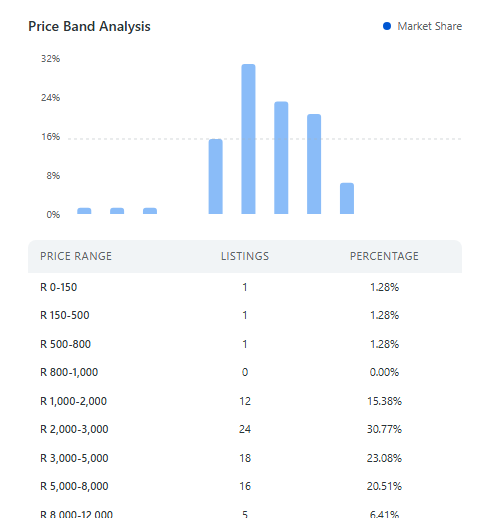
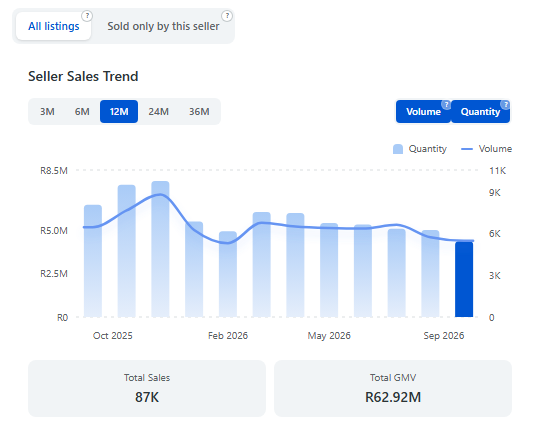
View estimated sales trends for the selected listings over 3, 6, 12, 24, or 36 months, depending on available data. Compare listing counts and percentages across price bands.
What you can see
- Estimated unit and sales value trends for the selected listings
- Total estimated units and sales value for the chosen period
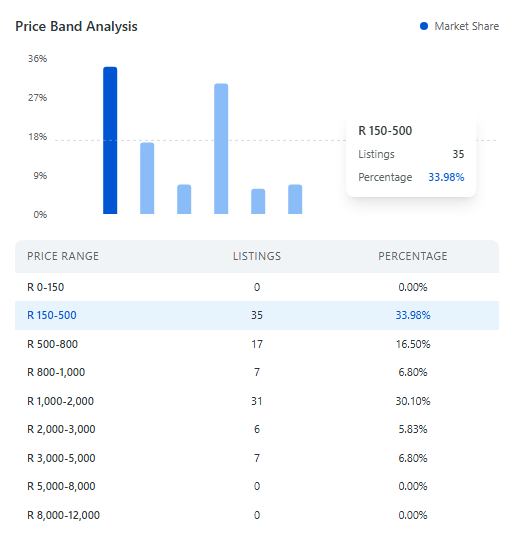
- Listing counts and their share within each price band
Why it matters
See how sales of these listings are changing and where their prices are concentrated to understand the seller’s product positioning.
Feature 03
Find leading listings, brands, and categories
Toggle between the top 5 listings, brands and categories for your selected scope. Compare estimated sales value, unit volume, and combined share.
What you can see
- Top 5 listings, brands, and categories
- Estimated sales value and unit volume
- Combined share of the top 5
Why it matters
Find listings with higher estimated sales value and see which brands and categories account for more of it. Use these results to choose products to compare first.
How to read a Takealot seller analysis
Don't judge a seller by one view. Compare all listings with listings sold only by this seller, then read brands, prices, and recent trends together.
SEE IT IN ACTION
How to make sense of the results
1. Start with the seller’s business mix
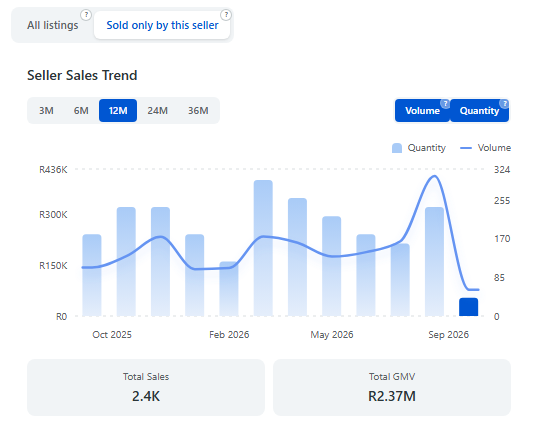
Compare the trend views. Across all listings, this seller’s estimated sales value over the past 12 months hits roughly R62.92M. For listings sold only by this seller, that figure falls to around R2.37M. This identifies them as a distribution / channel-focused seller: most of their revenue comes from reselling other brands, while their own-brand share is small.
2. Check the core brands they carry
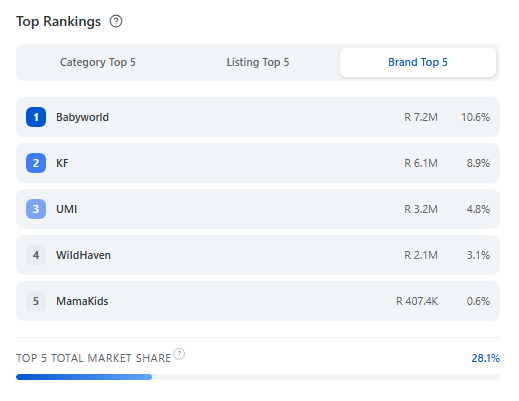
Open Brand Top 5. The top brand is Babyworld (roughly R7.2M, 10.6%), followed by their own brand KF (roughly R6.1M, 8.9%). Their performance relies heavily on leading third-party brands. When researching this seller, study how they sell Babyworld — don’t only look at their own brand.
3. Review price bands alongside recent trends
Most listings fall into two buckets: R150–500 (33.98%) and R1,000–2,000 (30.10%). This is a common setup: low-price items to pull traffic, paired with higher-priced goods for margin. Looking at the trend for items sold only by this seller, their own products spike sharply before September 2026 and then drop fast. This may be a seasonal peak — or a stockout.
4. Decide where to focus next
A distribution-style seller like this signals solid category demand, but it does not mean they excel at developing their own products. Research Babyworld to find comparable supply opportunities and capture similar traffic. You can also investigate the drop in their own sales: check whether the underlying product has weaknesses, and whether you can launch a clearer, differentiated alternative.
Explore a brand from the seller’s range in more detail with Brand Analytics. Continue with Brand Analytics.
Analyze a Takealot seller in 3 steps
Install INSYDOR and explore a seller’s product range directly on Takealot.
Install INSYDOR
Install the INSYDOR Chrome extension and sign in.
Open a product or seller page
Go to a Takealot product or seller page showing the seller you want to analyze.
Run seller analysis
In Market Research, open Seller Analysis and click Fetch Analysis. Switch between Exclusive and All to explore the results.
Explore competing sellers for your next product idea
See what they stock, find leading listings, and choose products for a closer comparison.
Install extensionNew product ranking, brand analysis, and seller analysis share the category analytics quota.